OF THE PORTUGUESE THAT, BEFORE THE PANDEMIC, WERE MOBILITY OUTSIDE THE HOME, 61% DIDN’T FOLLOW THE CONFINEMENT IN THE HOME, ON THE 29th.
The consultancy PSE studies the mobility of the Portuguese, continuously. This study is a panel that implies an APP installed on the mobile phones of the participating sample. Thus, the actual displacement of the population is monitored 24 hours a day. This study is highly rigorous because it records the location via GPS and concomitantly because it is based on a statistically representative sample of the universe under study. Technical note at the end.
The Total Confinement of the Portuguese, at home, can be decomposed between what is the Natural Confinement (who usually does not leave the house) and the Additional Confinement, made by the people who usually leave the house, but who are now at home.
Total Confinement At Home
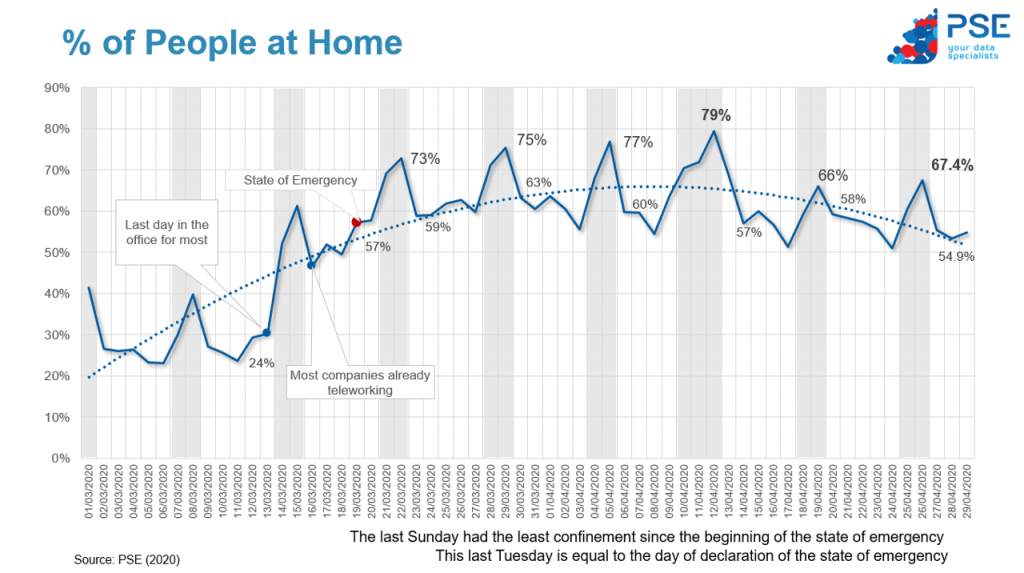
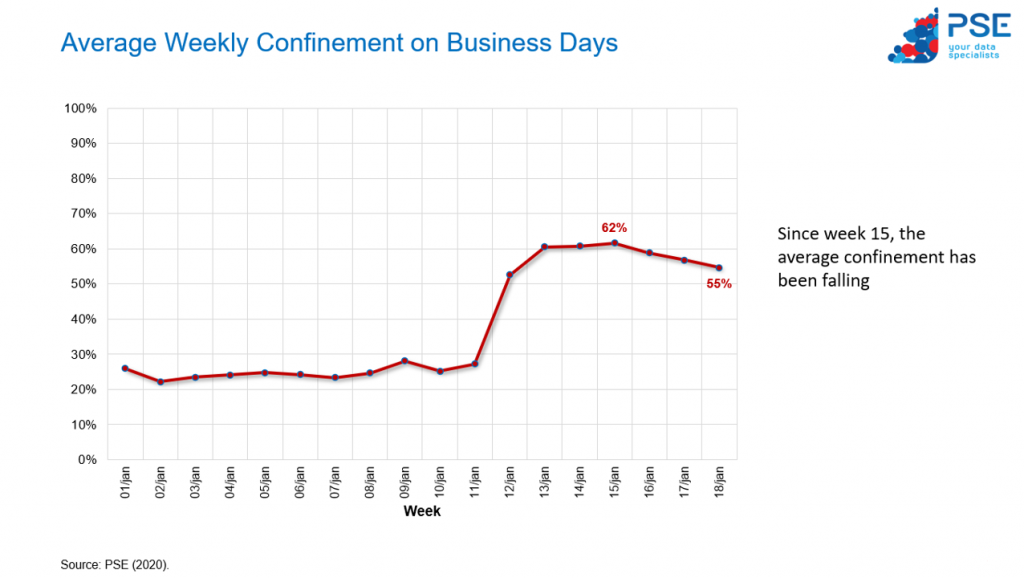
In the last 10 working days, total confinement at home has always maintained a downward trend, albeit a mild one. It is important to say that in the average of these last three working days, 54.6% of the population stayed at home. In other words, the voluntary quarantine continues to be at good levels, with just over 50% of the population confined. If we analyze the average weekly confinement on working days, we also see the downward trend since week 15.
What is Natural Confinement?
There is a part of the population that, even before the pandemic, already had a tendency to stay at home, on any given day. We call this “Natural Confinement”. In the period of working days between 1 January and 13 March 2020, on average, about 24.7% of the population was naturally confined to the home.
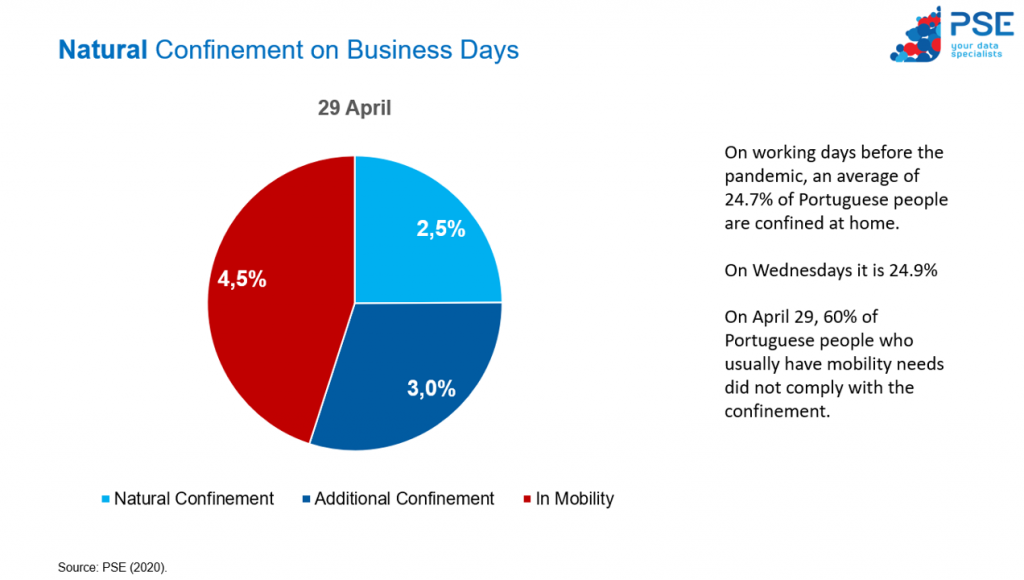
On Wednesdays, considering only the beginning of 2020 prior to the pandemic, Natural Confinement was 24.9%. Now we see that the Additional Confinement, in particular on April 29, was 30%. Adding the two values, we then reached 55% of the population in confinement at home. In short, on the average of 2020 before the pandemic, on Wednesdays, 75% of the population is mobile. Of this population that was normally mobile, 60% (45.0% / 75.1%) did not comply with the confinement. In conclusion, the data tell us that there are days, during this period of the state of emergency, when almost 2/3 of the population that usually circulates, is on the street!
Evolution of Additional Confinement On average, about 75% of the population, before the pandemic, had daily mobility needs. If we consider only this group of people, we can see the percentage of this group that now fulfills a “Confinement (Additional) at Home”, in the following graph:
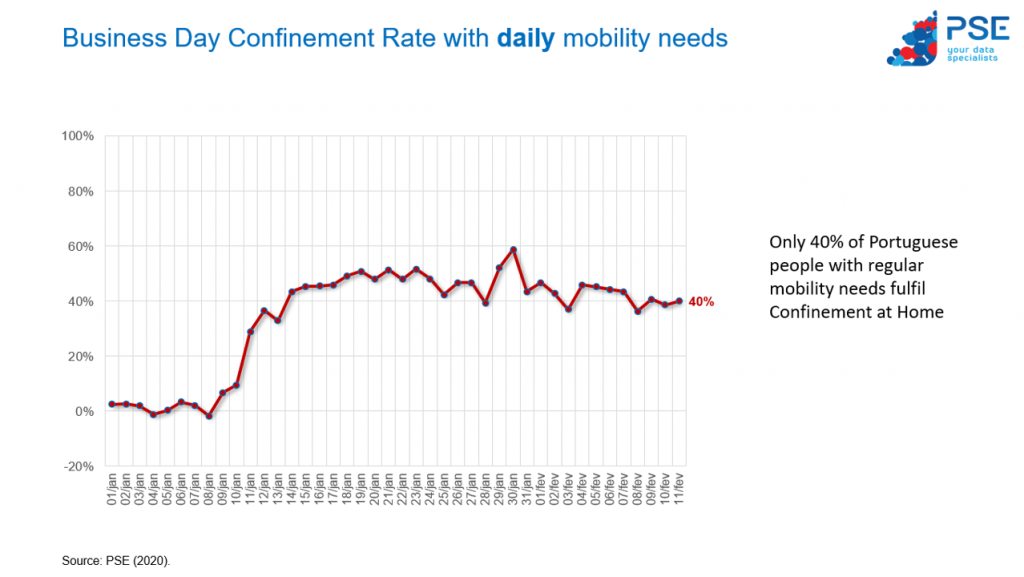
That’s, of the population that has regular mobility needs, only 40% fulfills the Confinement At Home on April 29, 2020.
During Municipal Confinement, the confinement rate of this population reached a maximum of 60%.
In addition to the 29th of April, last Friday the 24th also presented a low effective confinement, of 36%. In other words, almost 2/3 of the population that usually circulates on Fridays was in circulation, thus intensifying the movement on the streets.
Who else confined and de-defined?
The Easter period was a turning point in the behavior of the confinement. The trend of Confinement at Home was increasing until Easter, as we have seen in the first graph, and decreasing after this one. We can say that the movement of confinement was transversal in the different population segments. After Easter, the Portuguese have tended to “suspect”. In other words, increasing the number of people leaving home and their mobility.
Comparing the levels of Pre-Easter (14 / Mar-12 / Apr) and Post-Easter (13 / Apr-28 / Apr) confinement on working days we see that the tendency towards “deflation” is not the same in different ages, social classes and levels of education.
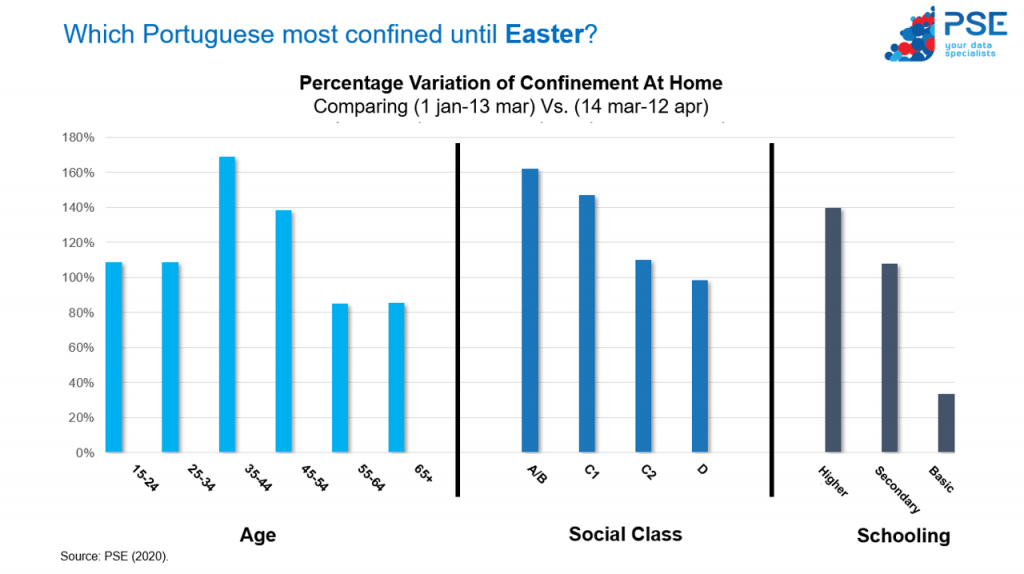
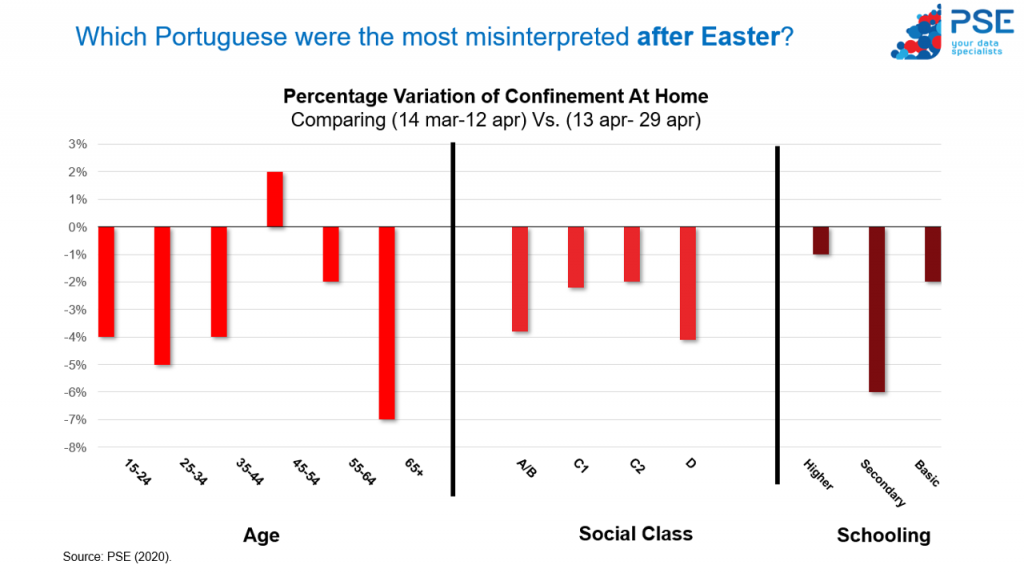
In terms of age, we can draw the following conclusions:
• The 35-54 year old segment was the one who most changed their behavior in terms of confinement due to their mobility, before the pandemic.
• Those who least changed their behavior towards confinement were the segment over 55 years old, because they already had higher levels of confinement at home, before the pandemic.
In the last few weeks, the tendency of lack of definition was more evident in the segment over 65 years old, and in the segment under the age of 44 years. The 45-54 segment was the one with the lowest tendency of deflation in the last weeks.
By socio-economic classes, we also see changes in behavior. The upper socioeconomic classes changed their mobility behavior more towards confinement than the lower classes. In the lack of definition, the extremes touch.
It was the upper and lower classes that presented, on average, greater lack of definition. Class D, if on the one hand it was the one that presented the lowest variation for confinement, is also the one that presented the greatest tendency towards deflation after Easter.
Similarly, schooling also presents differences in the movements of both confinement and deflation. In terms of schooling, we see that it was high schooling that changed the most in relative terms in the sense of confinement. In the lack of definition, it is people with secondary schooling who mostly unset on working days.
PSE CONTACT:
info@pse.pt
NOTE:
This study produces since 2019 data that are applied, above all, in the measurement of audience in outdoor advertising, to assist city councils in spatial planning and in the management of mobility and transport, and also in behavioral studies of mobility and shopper ”, For other companies and entities.
TECHNICAL NOTE:
This study is the PSE panel, with continuous data collection through location monitoring and means of travel via mobile application of a panel of representative individuals from the Universe over 15 years old, residing in the regions of Greater Porto, Grande Lisbon, North Coast, Central Coast and Faro District. This study implies an APP installed on the mobile phones of the participating sample. Thus we monitor the actual displacement of the population, at each hour of the day. This study is carried out 24 hours a day. The data are obtained rigorously, via GPS and with the consent of the monitored sample. For a universe of 6,996,113 individuals residing in the studied regions, the margin of error attributable to the study is 1.62% for a 95% confidence interval.

